Is Netflix undervalued? The short version
Our view is yes, and the risk is real. At $70.30 (the 9 October 2026 close) the shares trade at about 26 times underlying earnings of $2.68 per share: the same price as October 2021 on 2.4 times the earnings. Our base case puts the value at about $105 in about three years; our bear case is about $60 and is not a floor. Five standard valuation methods disagree, from $27 to $218. This is analysis, not a recommendation to buy or sell.
Netflix shares closed at $70.30 on 9 October 2026. That is roughly where they stood in October 2021, and about 48% below the peak of around $134 reached in 2025. (All prices are adjusted for the 10-for-1 stock split of November 2025.)
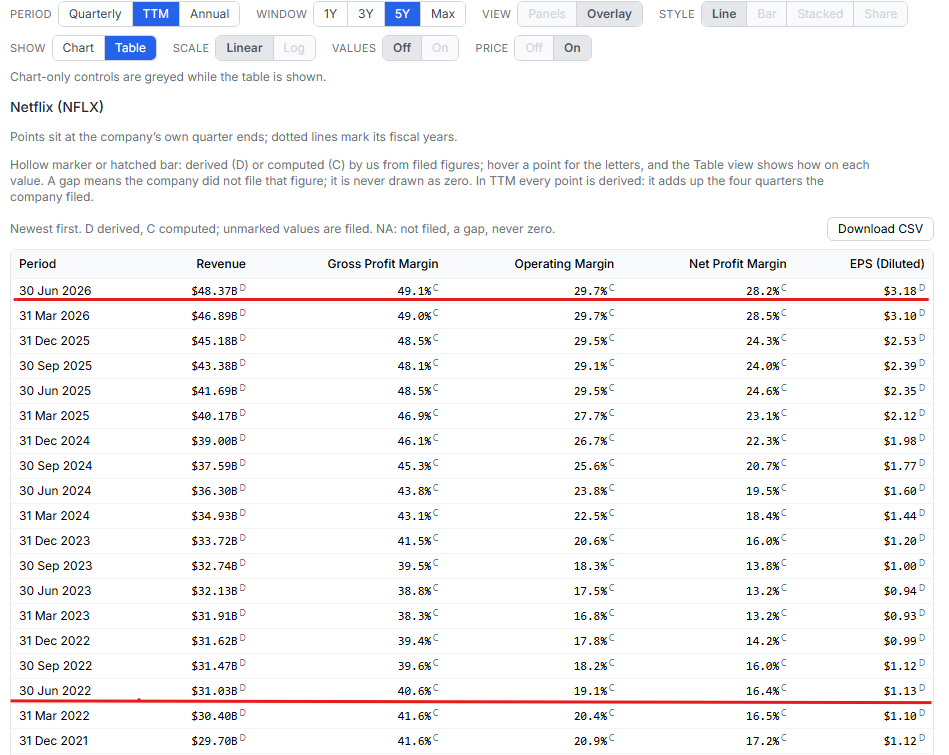
The business underneath has changed a great deal since then. Comparing the twelve months to June 2022 with the twelve months to June 2026:
- Revenue is up 56%, from $31.0B to $48.4B.
- Operating margin has widened from 19.1% to 29.7%.
- Underlying earnings per share are up 2.4 times, from $1.13 to $2.68.
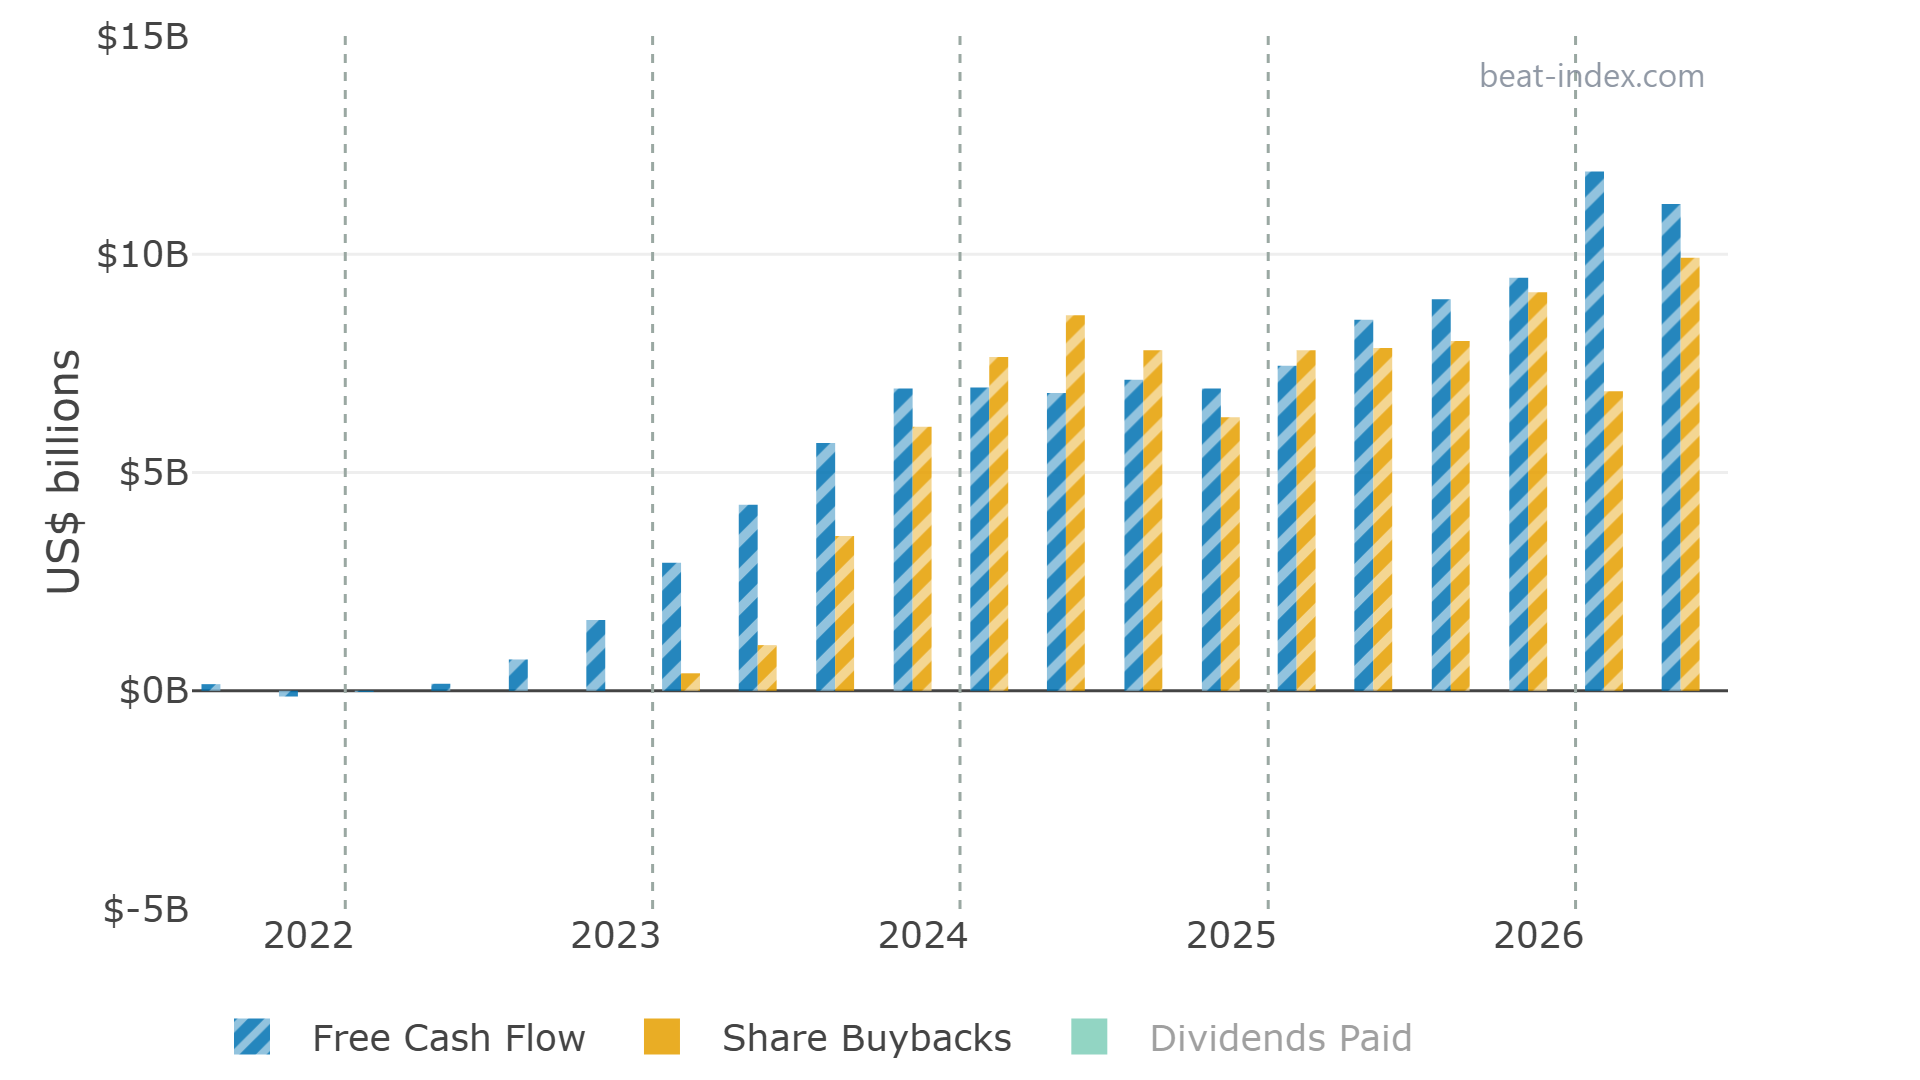
- The company has gone from no buybacks to spending about $9.9B a year on them: most of its reported free cash flow, and more than all of it once a one-off $2.8B fee is excluded.
Our base case points to a value of about $105 per share in about three years. That is an estimate built on assumptions we set out below, not a prediction of where the price will be. Below we show the figures, how we got there, and what could prove us wrong.
1. How has Netflix changed since 2021? Growth and margins
| Trailing twelve months to | Jun 2022 | Jun 2026 | Change |
|---|---|---|---|
| Revenue | $31.03B | $48.37B | +56% (11.7% a year) |
| Gross margin | 40.6% | 49.1% | +8.5 pts |
| Operating margin | 19.1% | 29.7% | +10.6 pts |
| Net margin, as reported | 16.4% | 28.2% | +11.8 pts |
| Net margin, excluding the one-off fee | 16.4% | 23.8% | +7.4 pts |
| Diluted EPS, as reported | $1.13 | $3.18 | 2.8x |
| Diluted EPS, excluding the one-off fee | $1.13 | $2.68 | 2.4x (24% a year) |
Revenue growth has not slowed as the company has grown. It has sped up: 13.0%, 14.8% and 16.0% for the twelve months to June 2024, 2025 and 2026.
Why we strip out the $2.8B Warner Bros. termination fee
Look closely and something stands out: in the twelve months to March 2026, net margin jumped from 24.3% to 28.5% while operating margin barely moved. Profit that appears below the operating line, without a matching improvement in the business, deserves a question.
The answer is in Netflix's own 10-Q for the quarter to 31 March 2026. Warner Bros. Discovery ended its merger agreement with Netflix in order to sign a deal with Paramount Skydance, and Netflix received a $2.8B termination fee, booked in "Interest and other income". By our estimate, that single item lifted the quarter's net income from about $3.1B to the $5.3B reported.
It will not repeat, so we remove it. We also remove about $85M of financing costs written off when the deal collapsed, a one-off charge in the other direction. That leaves underlying EPS for the twelve months to June 2026 at $2.68, not $3.18. The arithmetic: $2.8B less 21% tax is about $2.2B; less the $85M write-off, also after tax, leaves about $2.15B; spread over roughly 4.3 billion diluted shares that is about $0.50 per share, and $3.18 less $0.50 is $2.68. Every valuation figure below uses the lower number.
2. Is Netflix buying back more than its free cash flow?
Netflix bought back $600M of shares in 2021, then none at all in 2022. Over the most recent twelve months it reported about $11.1B of free cash flow and spent about $9.9B on buybacks. The $11.1B includes the $2.8B termination fee, which arrived in cash; without it, free cash flow was about $8.4B and buybacks exceeded it. It pays no dividend.
The buybacks show up in the share count: diluted shares are down about 5% since mid-2022. That is why EPS has grown faster than net income.
3. How profitable is Netflix? Returns on capital above 35%
Return on invested capital (ROIC) measures how much profit a business earns on the money tied up in it. Netflix's ROIC has been above 35% for five consecutive quarters, up from 24% in early 2024. It was already 36.7% in December 2025, before the termination fee arrived, so the fee is not what is driving it.

ROE in the same table (49.5% in June 2026) does include the one-off fee, which is why we lean on ROIC here.
4. What is Netflix's P/E ratio today? The price made a round trip; the business did not
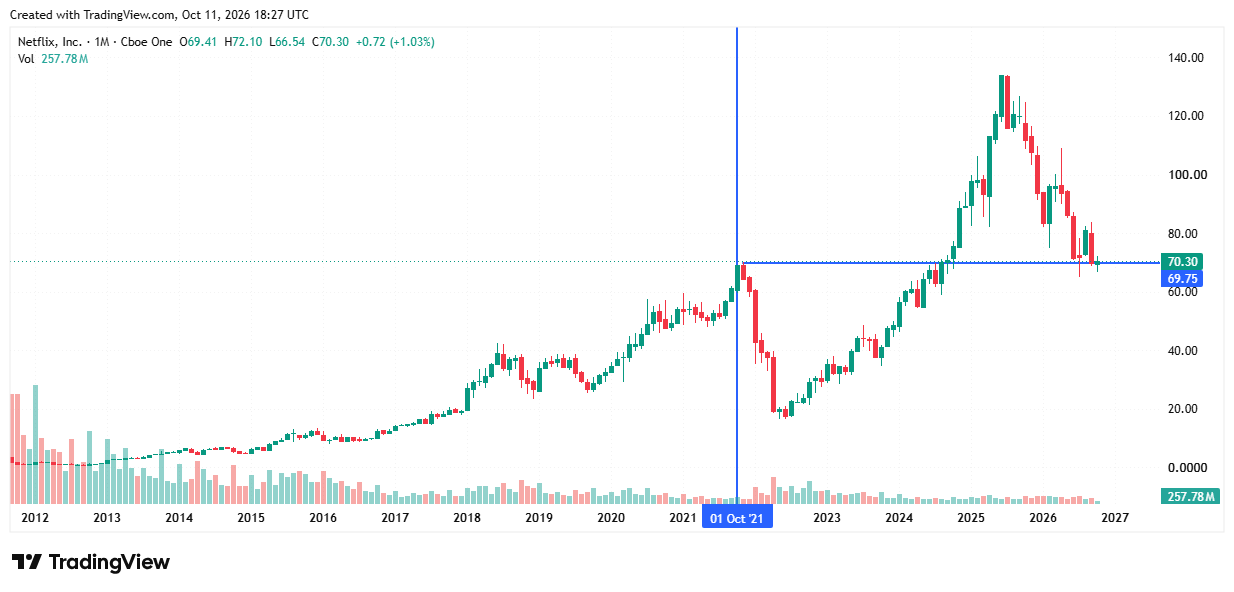
In October 2021 the shares traded at about $70 on trailing earnings of about $1.10 per share: more than 60 times a year's earnings per share. That multiple is the price-to-earnings ratio, or P/E, the most common quick measure of how expensive a share is. Today the shares trade at about $70 on underlying earnings of $2.68, a P/E of about 26. The price is the same; what you get for it is not.
Is $70 cheap by Netflix's own three-year standards?
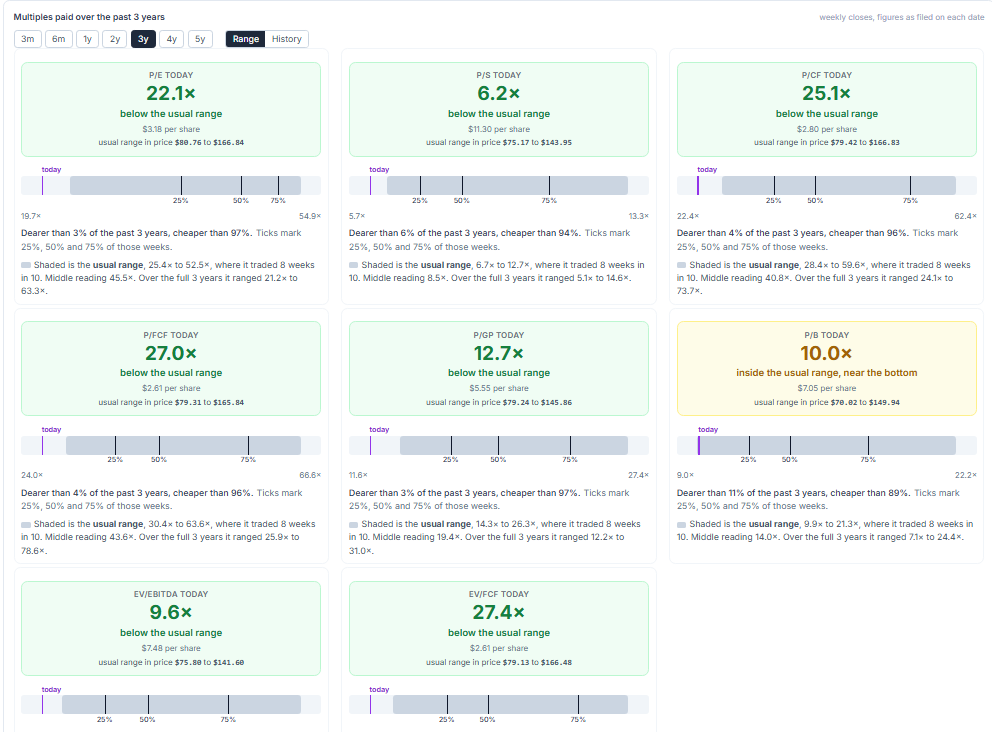
Our Market Multiples tab compares today's price with every weekly close of the past three years. On the figures as filed, seven of the eight multiples are below their usual range (the band where the shares traded eight weeks in ten), and price to book is inside it, near the bottom. Today's readings are cheaper than about 89% to 97% of those weeks. They are not the lowest ever paid: the shares were a little cheaper still in early October, near $67.
The card uses figures as filed, so its P/E of 22.1 and price to free cash flow of 27.0 include the $2.8B fee. Removing the fee from today's figures alone is not a fair test, because every weekly reading since April carried it too. Removed from both, the P/E (about 26) is still below its usual three-year range, and price to free cash flow (about 36) is just below it. Price to sales, price to gross profit and EV to EBITDA cannot be touched by the fee, and all three are below their usual range. EV to EBITDA flatters Netflix, because EBITDA adds back content amortisation, its largest cost, so we lean on sales and gross profit instead.
| Multiple | Today, as filed | Usual 3-year range | Cheaper than | Without the fee |
|---|---|---|---|---|
| P/E | 22.1 | 25.4 to 52.5 | 97% of weeks | about 26, still below (30.0 to 52.5) |
| Price to free cash flow | 27.0 | 30.4 to 63.6 | 96% | about 36, just below (36.1 to 63.6) |
| Price to sales | 6.2 | 6.7 to 12.7 | 94% | not affected |
| Price to gross profit | 12.7 | 14.3 to 26.3 | 97% | not affected |
| EV to EBITDA | 9.6 | 10.3 to 19.1 | 96% | not affected |
| Price to book | 10.0 | 9.9 to 21.3 | 89% | about 10.7, inside |
The pattern holds over shorter windows too. Over two years every multiple is below its usual range; over one year five of the eight are, with the cash flow multiples just inside. That is consistent with our view, not proof of it: a low multiple can also mean the market expects less growth, which is the second risk in section 6.
5. What is Netflix stock worth? Five lenses, and our base case
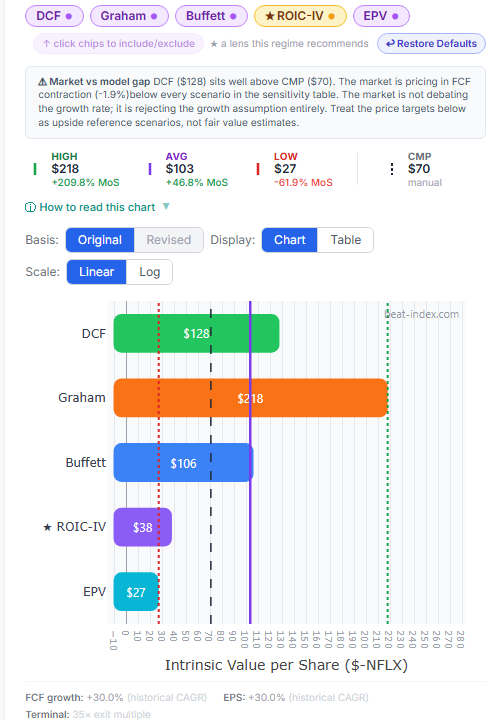
Our Intrinsic Value tab runs five standard valuation methods. In plain terms: DCF discounts projected cash flows; Graham applies Benjamin Graham's growth formula to earnings; Buffett values owner earnings; ROIC-IV values the business on the return it earns on its capital; EPV (earnings power value) assumes no growth at all. They disagree widely, from $27 to $218, and we think it is more useful to show that range than to hide it:
- The high end (Graham at $218, DCF at $128) assumes recent growth of about 30% a year continues, and those inputs still include the one-off fee. We do not rely on them.
- The low end (EPV at $27, ROIC-IV at $38) assumes little or no growth. EPV in particular values the company as if it stopped growing today.
- The average of the five is $103.
Our tool's own starred lens for a company with this profile is ROIC-IV at $38, and it labels the higher figures as upside reference points rather than fair values. We take a different view below, and we say why, but readers should know the tool and the author disagree.
Our own base case is simpler and uses only the underlying figures:
| Scenario | Assumption | Value in about 3 years |
|---|---|---|
| Bear | EPS grows 8% a year, P/E falls to 18 | about $60 |
| Base | EPS grows 15% a year, P/E stays at today's 26 | about $105 |
| Bull | EPS grows 20% a year, P/E rises to 28 | about $130 |
The bear case is not a floor. If earnings stalled and the market paid 15 times them, the shares would be worth about $40, close to the two low lenses above. A loss of half or more is within the range of outcomes.
The base case needs EPS growth of about 15% a year. That is in line with current revenue growth of 16%, before any help from buybacks, and well below the 24% a year that underlying EPS has grown over the last four years. It also sits close to the Buffett lens at $106. We treat that as a cross-check rather than support, because the tool's lenses start from reported figures that include the fee. (The $103 average of all five is a coincidence for the same reason: it includes the two high lenses we do not rely on.)
6. What could prove us wrong?
- Margins may have peaked. Operating margin has stayed between 29.1% and 29.7% for the last five quarters, after years of expansion. If content and marketing costs rise faster than revenue, earnings growth will fall back toward revenue growth or below it.
- The market may be right about growth. Our reverse discounted cash flow puts it this way: at $70, the price is consistent with free cash flow shrinking by about 2% a year. That would need a real slowdown in subscriber growth or a loss of pricing power. The free cash flow in that calculation includes the fee, so the market's implied pessimism is smaller than it looks.
- Capital allocation can change. The Warner Bros. Discovery episode shows Netflix was prepared to make a very large acquisition. A future deal could redirect cash away from buybacks, and buybacks above underlying free cash flow cannot continue indefinitely without borrowing.
- Competition and currency. Rival services, rising sports-rights costs and a stronger dollar can each slow reported growth without anything going wrong inside Netflix.
- Reported figures can mislead. As the $2.8B fee shows, headline EPS and net margin can include items that will not repeat. Check what is underneath before relying on any single number, including ours.
Conclusion: our view
Based on the data available and moderate growth estimates, we believe Netflix is undervalued at $70.30. We estimate it could be worth about $105 in about three years. That is about 49% above today's price in total, or about 14% a year. Netflix pays no dividend, so that would be the whole return. The market's own history points the same way: on price to sales and price to gross profit, which the fee does not affect, Netflix trades below its usual three-year range, and with the fee removed so does its P/E.
For comparison, the risk-free rate over the same period is the yield on a 3-year US Treasury: 4.85% on 8 October 2026, the latest published figure (Federal Reserve, FRED series DGS3). We use the 3-year rather than the more often quoted 10-year (5.22%) because it matches our three-year horizon. At 4.85% a year, $70.30 placed in Treasuries would grow to about $81 in three years with almost no risk. Our base case is about 9 percentage points a year above that. That gap is the reward for taking equity risk, and the bear case (about $60, and not a floor) shows the risk is real.
"Moderate" here means earnings per share growing about 15% a year, in line with current revenue growth and well below the 24% a year of the last four years, with the P/E unchanged at about 26.
This is our opinion, based on the company's filings and the future we can reasonably foresee today. It is not a recommendation to buy or sell, and it may prove wrong.
How we worked
Every financial figure comes from Netflix's 10-K and 10-Q filings with the US SEC, processed by the Beat Index pipeline. "TTM" means the trailing twelve months, the sum of the last four quarters. Per-share figures are adjusted for the November 2025 stock split. Where we adjust a reported figure, as with the termination fee, we say so and show the arithmetic. Share prices are from TradingView. The Market Multiples card uses figures as filed on each date, including the termination fee; where that matters we show the reading without it.
About the author
Krishna Prasad
Krishna Prasad is the founder of Beat Index, a former banker and a private investor. He is not a regulated financial adviser. The financial figures in this post come from Netflix's own filings with the US SEC; share prices are from TradingView.
Disclaimer. This is the author's personal opinion, for information only. It is not investment or financial advice, and not a recommendation to buy or sell any security. Valuations are estimates that depend on assumptions which may prove wrong, and you can lose money.
The author, his family, his tax-advantaged accounts and his wholly owned company hold NFLX and may buy or sell it at any time, including shortly after publication.
Published 11 October 2026 at a share price of $70.30.
Financial data: the company's own filings with the US SEC (EDGAR).