Micron vs AMD: the short version
Disclosure first: the author has owned AMD since April 2025 and has just started a position in Micron, and may add to it if the price falls further. Read what follows with that in mind.
If we had to choose one today, we would lean to Micron (MU) over AMD. Micron trades at about 12 times its last year's earnings and 18 times its free cash flow; AMD trades at about 147 times earnings and 112 times free cash flow. Micron now generates roughly seven times AMD's cash. On those numbers alone the choice looks obvious.
It is not obvious, and the reason is the memory cycle. Micron's last twelve months are the best in its history by a very wide margin: three years ago it was losing money on every chip it sold. A low P/E on peak earnings is the classic trap in memory stocks. Our base case values Micron at about $1,470 in three years if its free cash flow merely holds at today's level, our bear case at about $1,022, and our long-term value is about $1,327. At a 25 times exit, today's price implies Micron's cash flow falling about 7.4% a year. AMD, even at a generous 60 times exit, comes out at about $413. Both Micron figures assume this memory cycle lasts, so our lean is also a view on how long it lasts, and we show what happens if it does not. This is analysis, not a recommendation to buy or sell.
Prices used: Micron $906.98 and AMD $570.96, 15 October 2026.
1. When did Micron's cash flow overtake AMD's?
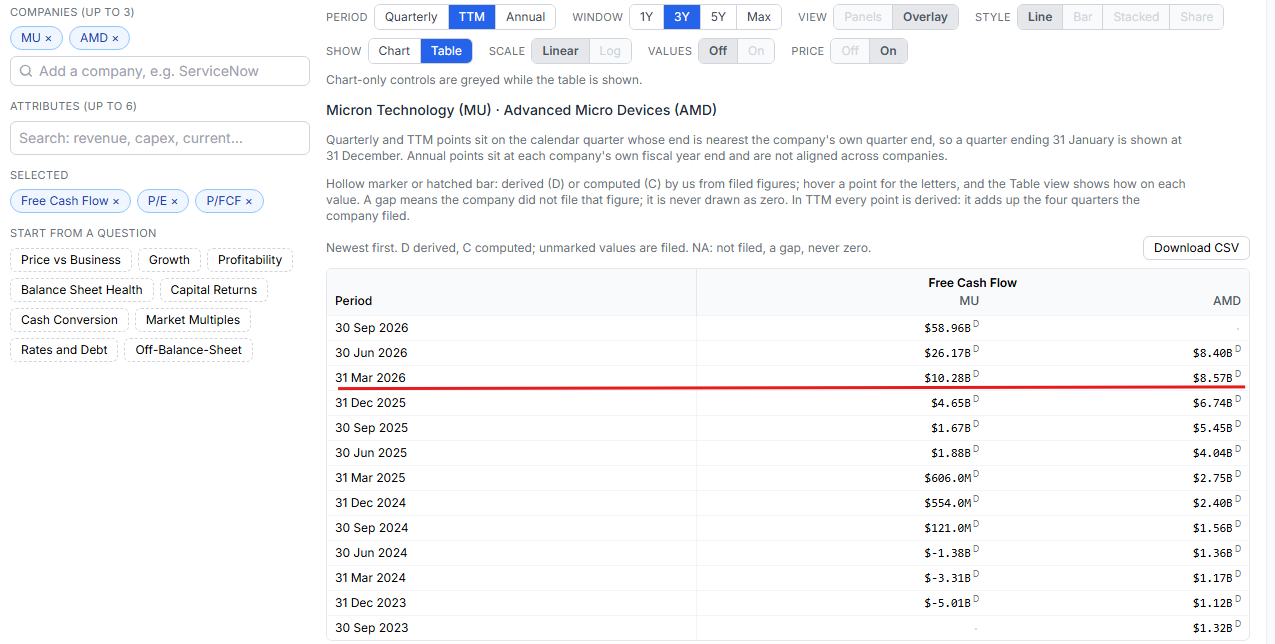
In the twelve months to March 2026, Micron's free cash flow ($10.28B) passed AMD's ($8.57B) for the first time. Since then it has not been close: $58.96B for Micron's fiscal year to early September 2026, against $8.40B for AMD's twelve months to June.
Two things about that comparison matter:
- The quarters are not the same. Micron's latest point includes its quarter to early September, from the 10-K it filed on 9 October. AMD has not yet reported its September quarter; it reports in early November. AMD's figure is three months older.
- AMD's free cash flow is after a step-up in investment. AMD's capital spending in the June 2026 quarter was $808M, against $282M a year earlier. Some of today's low free cash flow is spending ahead of revenue it expects to earn.
How Micron got here
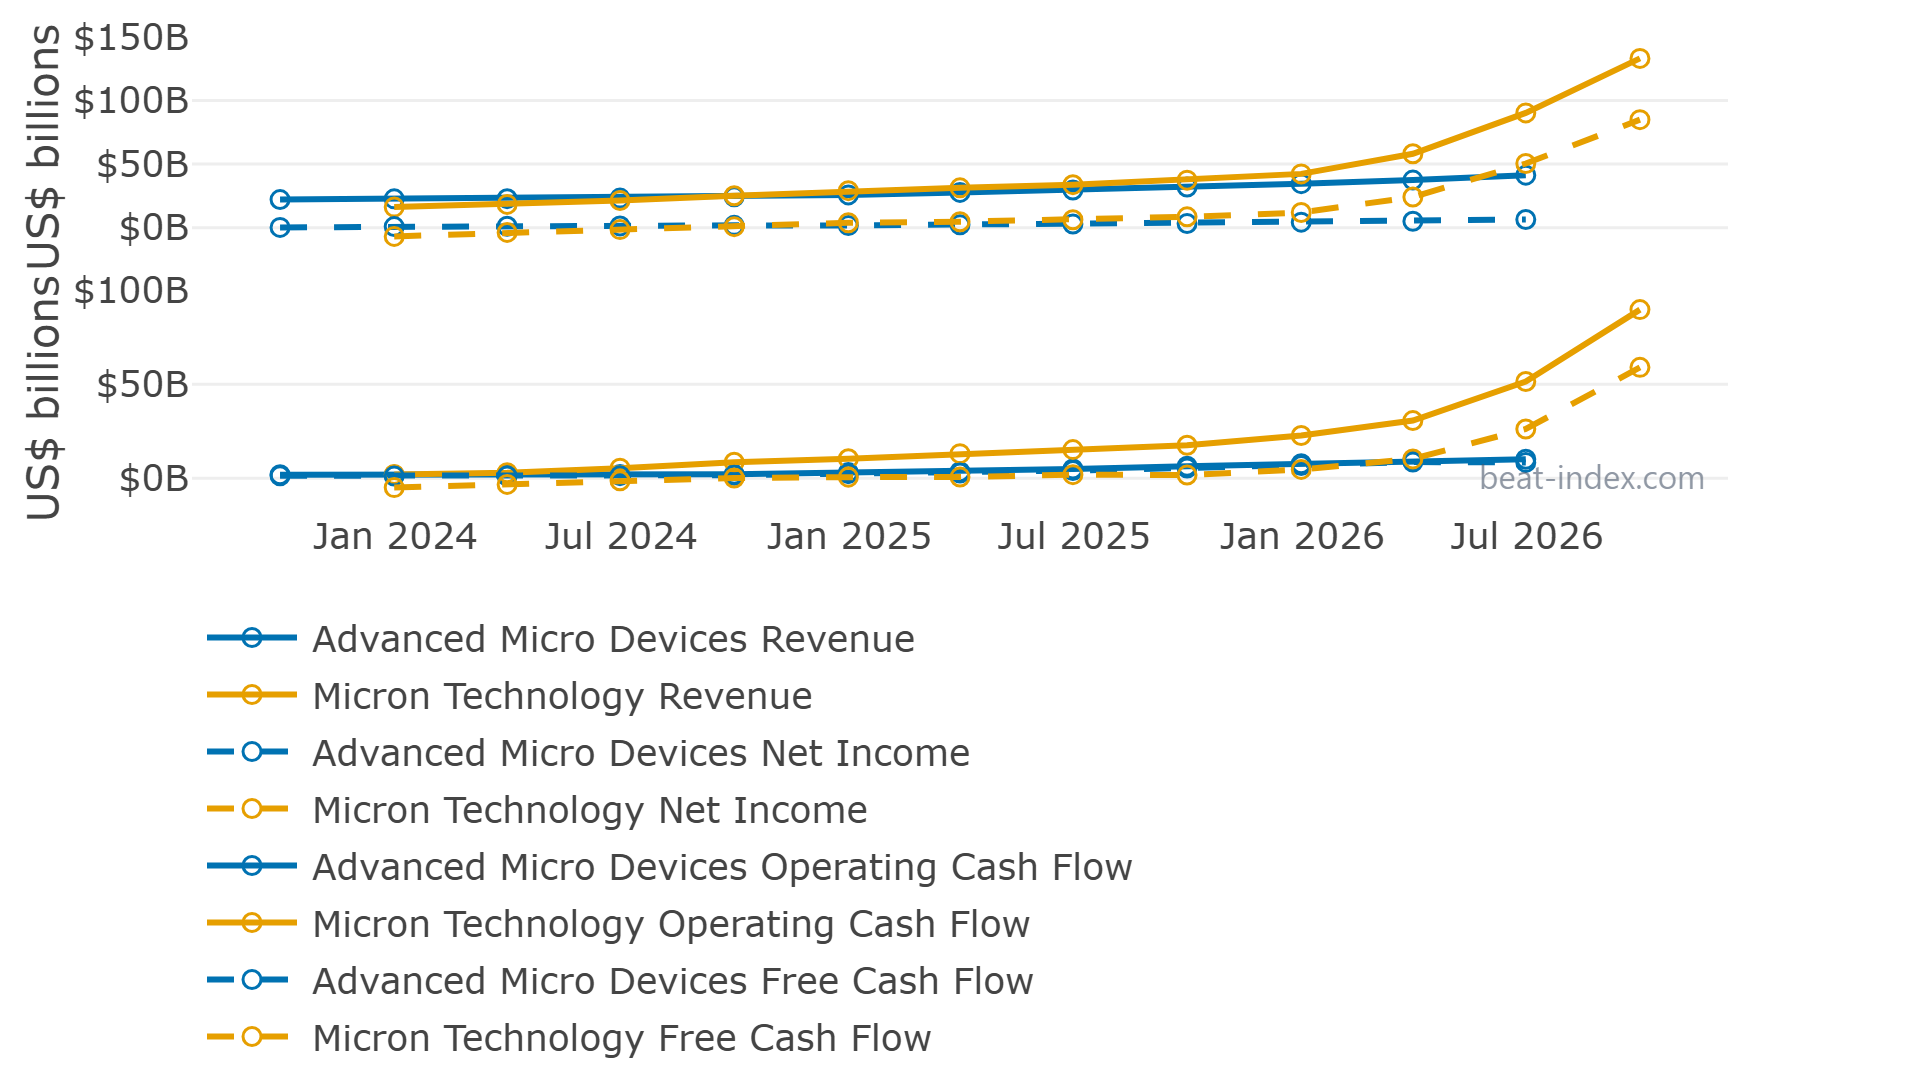
For most of the past three years the two companies tracked each other. From early 2026 Micron's lines bend sharply upward on every measure, while AMD's keep rising steadily.
| Micron, fiscal quarter | Revenue | Gross margin | Free cash flow |
|---|---|---|---|
| Q2 FY23 (Mar 2023) | $3.69B | (32.7%) | ($1.86B) |
| Q4 FY25 (Aug 2025) | $11.32B | 44.7% | $0.07B |
| Q2 FY26 (Feb 2026) | $23.86B | 74.4% | $5.52B |
| Q3 FY26 (May 2026) | $41.46B | 84.6% | $17.56B |
| Q4 FY26 (Aug 2026) | $54.23B | 86.8% | $32.86B |
Micron's revenue for fiscal 2026 was $133.2B, up from $37.4B the year before. In the six fiscal years from 2020 to 2025, its free cash flow added up to about $1.3B in total. In fiscal 2026 alone it was $59.0B. Demand for high-bandwidth memory from AI data centres, and a shortage of ordinary DRAM, have pushed memory prices to levels the industry has not seen before.
Are customer prepayments flattering Micron's cash flow?
No. Customers paid Micron $12.7B in fiscal 2026 as deposits to secure future supply, and its 10-K books that money as a financing inflow, not as operating cash. Free cash flow is operating cash flow less capital spending, so the $58.96B above already excludes the deposits. Had they been counted, free cash flow would have been about $71.7B. Nor is working capital doing the lifting: customers owed Micron $25.2B more at the year end than at the start, and that alone held operating cash flow back by more than all the increases in what Micron owed.
What the deposits do provide is visibility. The 10-K reports $134B of contracted revenue still to be delivered (remaining performance obligations), about a quarter of it expected within twelve months and all of it within five years, backed in part by $7.0B of customer letters of credit. That is about one year of fiscal 2026 revenue already under contract, which is part of why we think this cycle can run for years rather than quarters.
2. Which is cheaper on P/E and price to free cash flow?
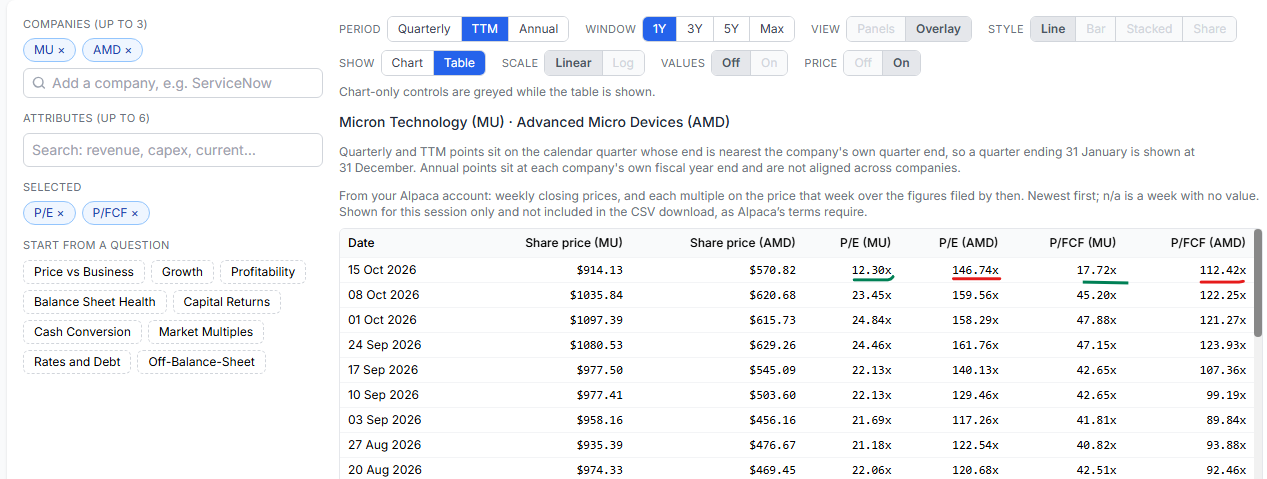
| 15 October 2026 | Micron | AMD |
|---|---|---|
| Share price | $906.98 | $570.96 |
| P/E, trailing | 12.2 | 146.8 |
| Price to free cash flow, trailing | 17.6 | 112.4 |
| Net cash | $38.3B | $9.9B |
Two cautions before reading the table as "Micron is cheap":
- Micron's P/E halved in a week, and the price fell. On 8 October Micron's P/E was 23.5. On 15 October it was 12.3. Its 10-K arrived in between and replaced a weak quarter from a year ago with a record one, roughly doubling trailing earnings. Over the same fortnight the shares fell from $1,097 to about $907. The market was offered a much lower P/E and chose to pay less, not more. That is what it looks like when investors think earnings are near a peak.
- AMD's P/E overstates how expensive it is. AMD's reported earnings carry about $2.2B a year of amortisation of intangible assets from its Xilinx and ZT Systems acquisitions, a non-cash charge. Adding it back puts AMD's P/E nearer 110 to 120 than 147. Price to free cash flow is not affected by that charge, which is why we lean on it: 112 times.
Even after both adjustments the gap is enormous. The question is whether Micron's earnings are a new level or a peak.
3. What is the market pricing in? Two reverse DCFs
A reverse discounted cash flow (reverse DCF) runs the usual valuation backwards: instead of estimating growth and solving for a value, it starts from today's price and solves for the growth the price implies. Both runs below use a 10% required return over three years.
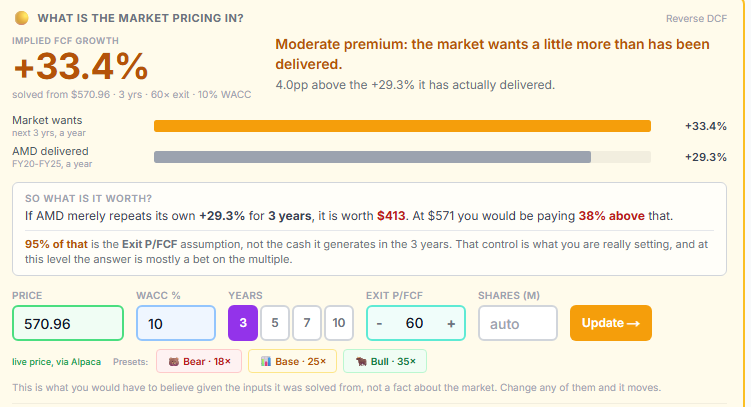
AMD. Even if the market is still willing to pay 60 times free cash flow in three years, a very generous assumption, today's price needs AMD's free cash flow to grow about 33% a year. AMD has delivered about 29% a year since 2020. If it merely repeats that, the card values it at $413, 28% below today's price, and 95% of that value comes from the assumed exit multiple, not the cash earned along the way.
Put the other way: at a more ordinary 30 times free cash flow in 2029, $571 needs AMD to be generating about $40B of free cash flow a year by then, roughly five times today's $8.4B, or about 70% growth a year. That is possible. AMD is the only proven alternative to Nvidia for AI accelerators, and its agreement with OpenAI to supply 6 gigawatts of MI450 systems starting in the second half of 2026 is exactly the kind of revenue that could get there. But the price already assumes it is delivered, on time, at scale.
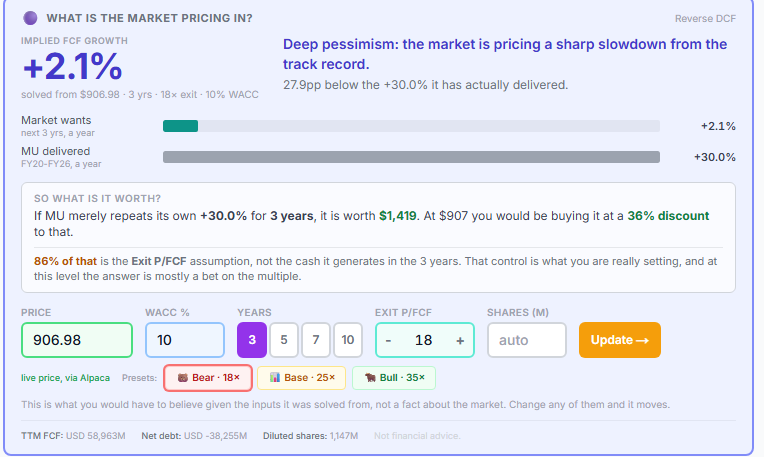
Micron. At an exit multiple of 18 times free cash flow, the tool's bear preset, today's price needs Micron's free cash flow to grow only about 2% a year. On its face, that makes Micron look deeply undervalued.
The catch is the starting point. That 2% a year is growth on $59B, the best year in Micron's history. The price is assuming Micron holds a record-cycle level of cash flow for three more years, then sells at 18 times it. If memory prices fall back even part of the way, that assumption fails.
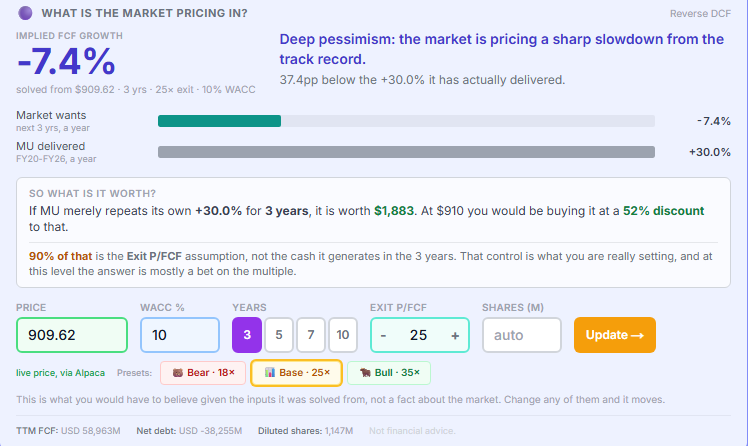
At the tool's base preset of 25 times free cash flow, the picture changes. Today's price then implies Micron's free cash flow falling about 7.4% a year for three years. If it merely holds at this year's $59B instead, the same calculation values Micron at about $1,126 today. That is our base case: no growth, no decline, and a multiple in line with what the market paid for Micron's cash flow through most of the past year.
The card also says Micron "delivered +30.0% a year". Treat that figure with care: it is the tool's ceiling, not a measurement. Our engine caps historical growth at 30% so that one extreme year cannot dominate. Micron's actual free cash flow growth from fiscal 2020 to 2026 was far higher, because it started from $83M, almost nothing. Neither number is a sensible guide to the next three years. The same caveat applies to the $1,419 on the card.
4. What is each company worth? Five lenses, and our cases
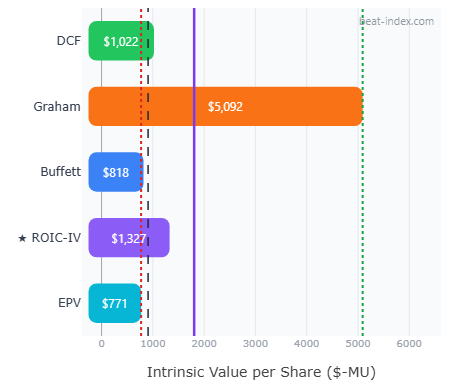
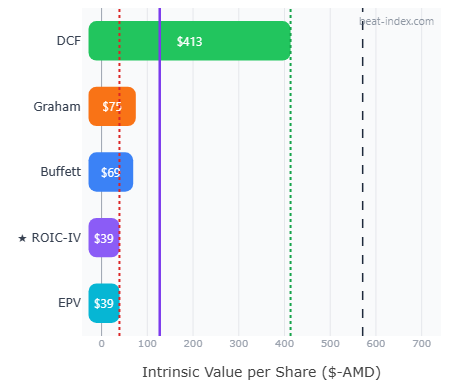
| Lens | Micron | AMD | What it assumes |
|---|---|---|---|
| DCF | $1,022 | $413 | Cash flow over a few years plus an exit multiple |
| Graham | $5,092 | $75 | Benjamin Graham's growth formula on earnings |
| Buffett | $818 | $69 | Owner earnings, valued as a perpetuity |
| ROIC-IV (starred) | $1,327 | $39 | The return the business earns on its capital |
| EPV | $771 | $39 | Today's earnings, with no growth at all |
| Share price | $906.98 | $570.96 |
AMD. Every lens is below the price. Four of the five are a fraction of it; the DCF only reaches $413 at a 60 times exit. The lenses are built on today's earnings and cash flow, and AMD's value rests on growth that has not yet arrived, so they are harsh on it by design. Still, there is no lens on which AMD looks cheap.
Micron. Three lenses are above the price and two below. We do not use Graham's $5,092: it would make Micron worth over $5 trillion, and it applies 30% growth to record earnings.
Our view rests on three figures:
- In about three years: $1,022. The DCF lens, run with no growth at all. It assumes Micron's free cash flow simply stays at this year's level, with no increase, and values it at an ordinary multiple at the end. We treat it as our bear case for the current cycle, about 13% above today's price.
- Our base case: about $1,126 today, about $1,470 in three years. The reverse DCF from section 3 at a 25 times exit, with free cash flow simply holding at $59B. In three years that is 25 times $59B plus the cash Micron would have built up meanwhile (today's $38B net cash and three more years of free cash flow), over about 1.15 billion shares.
- Over the long term: $1,327. ROIC-IV, the tool's starred lens, which values Micron on the return it earns on the capital it employs, without tying the answer to a particular year.
Buffett at $818 and EPV at $771 sit a little below the price, and both also assume no growth. Read together, the four lenses we keep say that at $907 the market is pricing Micron's record cash flow to decline, not to hold.
What our bear case assumes, and what it does not. "No growth" is not the same as "the cycle turns". All four lenses start from fiscal 2026, a year with an 86.8% gross margin in its final quarter and a return on invested capital of about 107%. No memory maker has held numbers like that for long. If memory prices fall back, Micron's cash flow does not stay flat, it shrinks, and the value is lower than our bear case. To show how much lower, here is the same three-year question on cycle assumptions, at a more conservative 15 times free cash flow rather than the 25 times in our base case (about 1.14 billion shares, net cash building while the cycle lasts):
| If the cycle... | Assumption for fiscal 2029 | Value in about 3 years |
|---|---|---|
| Breaks in 2027, as in 2023 | Free cash flow about $8B, 15x, net cash about $70B | about $170 |
| Returns to a mid-cycle year | Revenue about $90B, gross margin about 55%, free cash flow about $35B, 15x, net cash about $110B | about $560 |
| Stays tight for years | High-bandwidth memory stays short of supply. Free cash flow about $90B, 15x, net cash about $150B | about $1,300 |
Our $1,022 and $1,327 therefore carry one central assumption: that this cycle runs for years rather than quarters. We think that is the more likely outcome, given how much AI infrastructure is still being built and how far ahead customers are prepaying for supply. It is also the assumption most likely to prove us wrong. What makes Micron the lower-risk choice in our view is that the next year or so is cushioned by $38B of net cash, several more strong quarters already visible in prepaid orders, and a price that already expects a decline, while AMD's price needs almost everything to go right.
5. What could prove us wrong?
Micron
- The cycle turns. Samsung, SK Hynix and China's CXMT are all adding capacity against margins near 87%. When supply catches up, memory prices fall fast, and Micron's earnings fall faster. In fiscal 2023 its gross margin went below zero.
- Spending into a downturn. Micron spent $30.7B on capital investment in fiscal 2026. Plants ordered at the peak arrive when they are least needed, as in 2023.
- Contracts are not cash. The $134B of contracted revenue and $13.0B of deposits depend on terms we cannot see in full, including pricing adjustments (Micron already reserves $4.3B for them) and what happens if a large customer's plans change.
- China and export controls. Rules on memory sales to China, and China's own response, can change Micron's market overnight.
AMD
- Execution against Nvidia. The MI450 rack-scale systems have to ship on time and compete with Nvidia's next generation. A delay of a quarter or two matters a great deal at 112 times free cash flow.
- Concentration on OpenAI. Much of the expected growth rests on one customer, which is itself raising very large sums to pay for the build-out. The deal also gives OpenAI warrants over up to 160 million AMD shares, about 10% dilution if exercised.
- No room for error in the price. The reverse DCF shows the price already assumes faster growth than AMD's record, at a high exit multiple.
- Margins during the ramp. Large data-centre systems carry lower margins than AMD's chips alone, at least at first.
Both: one bet, not a hedge
Micron and AMD look like opposites, one cheap and one expensive, but they are paid by the same customers: the hyperscalers and AI labs building data centres. If that spending pauses, both fall together. Micron would fall on memory prices, with its full operating leverage; AMD would fall on its multiple. Owning both is two positions on one variable, not a balanced pair.
6. Against the risk-free rate: $1,000 in Treasuries or in Micron?
Any share has to beat what you could earn with almost no risk. That benchmark is a US Treasury held to maturity. The latest published yields (Federal Reserve, FRED series DGS3, DGS5 and DGS10, 13 October 2026) are 4.90% for 3 years, 5.00% for 5 years and 5.21% for 10 years.
| $1,000 placed in | Yield a year | Held for | Worth at the end |
|---|---|---|---|
| 3-year Treasury | 4.90% | 3 years | about $1,154 |
| 5-year Treasury | 5.00% | 5 years | about $1,276 |
| 10-year Treasury | 5.21% | 10 years | about $1,662 |
These assume the interest is reinvested at the same yield and the Treasury is held to the end. Sold early, a Treasury can lose value if rates rise.
The same $1,000 in Micron at $906.98 buys about 1.10 shares. In about three years, on each of the values above:
| If Micron is worth, in about 3 years | $1,000 becomes | A year | Against the 3-year Treasury ($1,154) |
|---|---|---|---|
| $170, the cycle breaks in 2027 | about $187 | (42.8%) | ($967) |
| $560, a mid-cycle year | about $617 | (14.8%) | ($537) |
| $1,022, our bear case, no growth | about $1,127 | 4.1% | ($27) |
| $1,300, the cycle stays tight | about $1,433 | 12.7% | $279 |
| $1,470, our base case, flat cash flow at 25x | about $1,621 | 17.5% | $467 |
Micron also pays a small dividend, about $2 over three years on $1,000, which does not change the picture.
Three things stand out. First, our base case beats every Treasury: about 17.5% a year against 5.21% for the 10-year, and in three years it comes close to what the 10-year Treasury pays over ten ($1,662). Second, our bear case of $1,022 earns about 4.1% a year, a little less than the 3-year Treasury's 4.90%: if that is all Micron delivers, the risk would not have been paid for. The case for owning Micron rests on the cycle lasting long enough to reach values above that. Third, our long-term value of $1,327 turns $1,000 into about $1,463. At 5.21% a year, $1,000 in Treasuries also reaches about $1,463 after seven and a half years. So the long-term value beats the 10-year Treasury only if Micron gets there sooner than that; any later, and the Treasury wins with almost no risk.
Conclusion: where we lean, and how
On the data available today, we lean to Micron over AMD. AMD is the most credible alternative to Nvidia anywhere, and we expect it to grow strongly, but at 112 times free cash flow the price already pays for that growth, and every valuation lens we run puts it below today's price. Micron generates about seven times the cash, holds $38B of net cash, and its price already assumes its earnings will fall.
Based on the data available, we believe Micron is worth about $1,470 in three years in our base case, where free cash flow simply holds at $59B and the market pays 25 times it; about $1,022 in our bear case; and about $1,327 over the long term. Our base case would beat even the 10-year Treasury by a wide margin. AMD, on a generous 60 times exit, is worth about $413 against a price of $570.96. Those Micron figures assume this memory cycle lasts; if it turns in 2027 the value could be far lower, as section 4 shows. Against the risk-free rate, the bear case alone (about 4.1% a year) would trail a 3-year Treasury at 4.90%, so the reward for owning Micron lies in the cycle running longer. The way we would act on the view therefore matters as much as the view:
- Start small and stage it. A partial position now, adding only on a meaningful fall if memory contract prices are holding, not on momentum.
- Watch the leading indicator, not the price. The first quarter in which Micron's gross margin stops rising, or memory contract prices roll over, is the signal to reduce.
- AMD: hold, not add, until it reports. Its early-November results should show whether MI450 shipments are on schedule.
This is our opinion, based on the companies' filings and what we can reasonably foresee today. It is not a recommendation to buy or sell, and it may prove wrong.
How we worked
Every financial figure comes from Micron's and AMD's 10-K and 10-Q filings with the US SEC, processed by the Beat Index pipeline. "Trailing" and "TTM" mean the last four quarters added together. Micron's fiscal year ends in late August or early September, so its fiscal fourth quarter is derived from its annual report less its first nine months; AMD's latest filed quarter ends in June 2026. Free cash flow is operating cash flow less purchases of property, plant and equipment, as filed. The three cycle scenarios for Micron are our own estimates on the assumptions stated; the share prices were entered as of 15 October 2026; the five lenses and the reverse DCFs are produced by the Beat Index Valuation tab with the settings shown on each card.
About the author
Krishna Prasad
Krishna Prasad is the founder of Beat Index, a former banker and a private investor. He is also an algorithmic trader who runs his own bespoke algorithms and licenses them to proprietary trading firms. He is not a regulated financial adviser. The financial figures in this post come from Micron's and AMD's own filings with the US SEC.
Disclaimer. This is the author's personal opinion, for information only. It is not investment or financial advice, and not a recommendation to buy or sell any security. Valuations are estimates that depend on assumptions which may prove wrong, and you can lose money.
The author, his family and his wholly owned company hold MU, AMD and may buy or sell it at any time, including shortly after publication.
Published 15 October 2026 at a share price of $906.98.
Financial data: the company's own filings with the US SEC (EDGAR).