Learn
Short videos on reading a company from its filings, and on getting the most from each view.
Walkthroughs of each tab in the app.
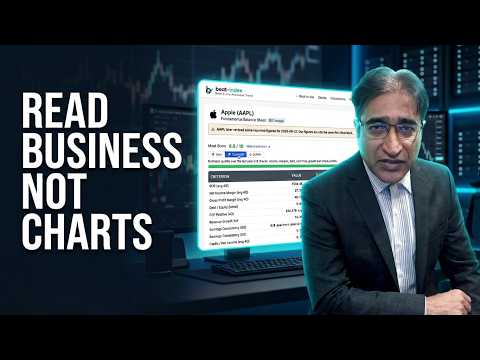 13:51
How to use Beat Index
A full tour of Beat Index using Apple as the example: where the numbers come from (the company's own SEC filings), the Moat Score, revenue and income charts with their period and style controls, plain-English "how to read this chart" guides, the live price chart, point-in-time momentum and market multiples.
 12:25
How to use Beat Index, part 2: charts, revisions and Priced In
Learn more Beat Index features: chart controls, subtabs, revised filings, minority interest, and what the options market prices in. In this second walkthrough you will see how to: 1. Use the chart controls: zoom with a pinch or the mouse wheel, pan left and right, double click to reset, autoscale, and save a snapshot. 2. Explore charts with subtabs, such as Revenue and Income (Main, Growth, Segments), Cash Flow and Intrinsic Value. Some companies file segment data only once a year, at their fiscal year end. 3. Spot revised filings. When a company reclassifies earlier figures in a later filing, Beat Index detects it, shows an amber header, and marks the affected points with a ring. Switch between Original and Revised, or open the table to see both values side by side. 4. Read income attributable to minority shareholders, using NextEra Energy and Palantir as examples: part of the consolidated profit belongs to the outside owners of a subsidiary, not to the parent's shareholders. 5. Use the Priced In tab to see the move the options market implies over the next week, the next month and up to the next earnings report, along with how the stock moved after each of its last 8 earnings announcements. Priced In needs a connected market data account (Alpaca). The implied moves are probabilities from the options market, not forecasts or advice.