Institutional-Grade Fundamental Analysis.For Every Investor and Trader.

The same depth wealth managers and portfolio analysts rely on, sourced directly from SEC filings. No vendor estimates, no black boxes. Whether you're making your first investment or managing a fund, you deserve to read the filing, not the headline.

Backtest

Test the thesis before you trade.

Backtest your assumptions against historical filings.

Backtest: Test the thesis before you trade.

BEAT Every Available Trend

Your money. Your life. Run on data, not Euphoria.

Mission

Making institutional-grade financial analysis accessible.

Make institutional-grade financial analysis accessible to every serious investor.

Motto

Primary source. No black box.

Every metric you see traces back to an SEC filing. No estimates, no vendor adjustments, no opacity.

Vision

Wall Street depth, for every investor.

A world where any investor analyses a company with the same depth as a Wall Street analyst.

Why Analysts, Investors and Traders choose Beat Index?

Twenty analysis tabs. Every metric sourced directly from SEC EDGAR filings. No estimates, no vendor adjustments, no black box.

๐Ÿ“

Market Multiples

What buyers have actually paid for this business, week by week, over the past five years, and where today sits against that range. A price divided by a figure the company filed, with no forecast and no model in between.

โšก

Momentum

Track price momentum against fundamental catalysts. Identify when market sentiment outpaces the filings, or lags behind them. Know what's moving before you decide to move with it.

๐Ÿ“ˆ

Revenue & Income

Revenue growth, quality, and margin trajectory computed from every filed income statement. See whether earnings strength is real and recurring, or propped up by one-off items. Cut through consensus noise.

๐Ÿ’ฐ

Cash Flow

Free cash flow, operating cash flow, and CapEx allocation, period by period, direct from the filing. Earnings can be managed; cash cannot. The single lens serious investors never skip.

๐Ÿ“Š

Margins

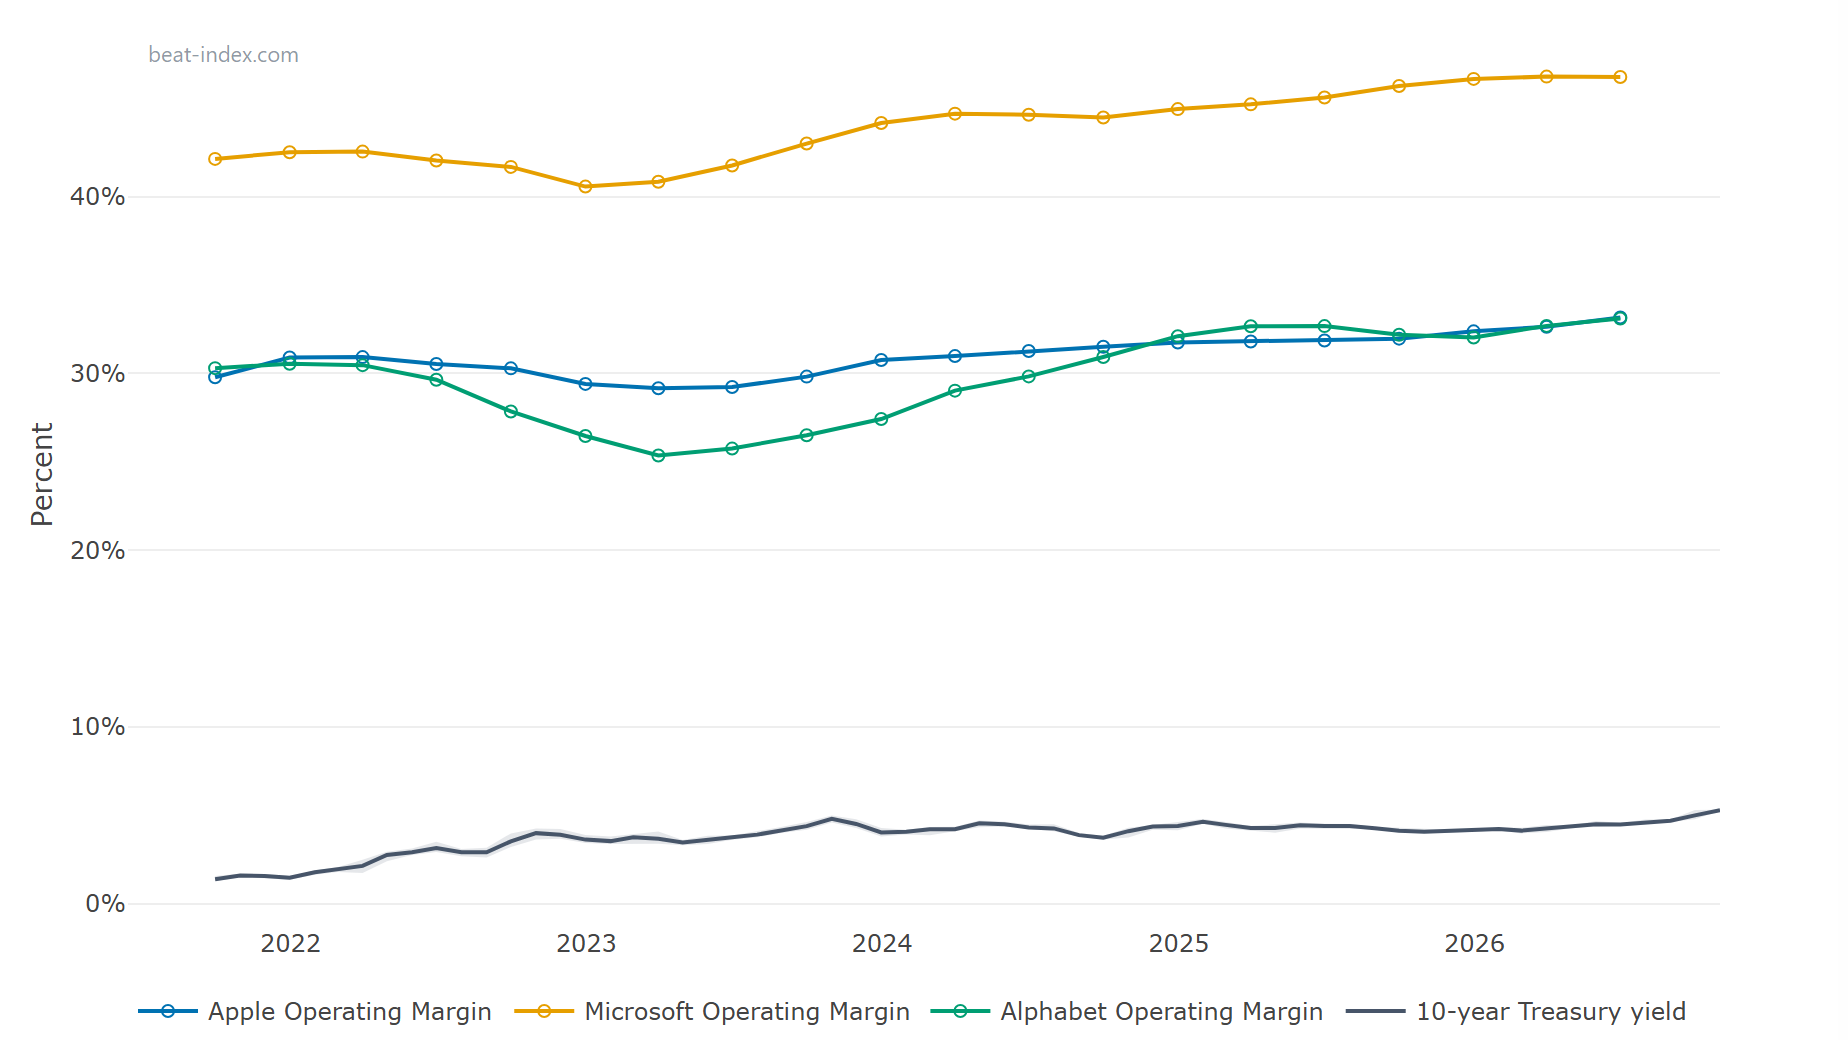
Gross, operating, net, and EBITDA margins across every reported period. Catch compression or expansion before it hits consensus estimates. Margins reveal whether a competitive advantage is holding or cracking.

โš–๏ธ

Liquidity & Leverage

Current ratio, quick ratio, debt-to-equity, and interest coverage, sourced from primary XBRL filings. Stress-test a balance sheet before markets price in the risk. Know whether a company can survive a downturn.

๐ŸŽฏ

Returns

ROIC, ROE, ROA: the metrics that separate compounders from capital destroyers. Track return on invested capital over time to judge whether management is building or eroding shareholder value.

๐Ÿ”„

Working Capital

CCC, DSO, DIO, DPO: institutional-depth metrics rarely available at this price point. Understand whether a company finances itself on supplier credit or is stretched on receivables. The lens Wall Street analysts use that most portals skip.

๐Ÿ’Ž

Intrinsic Value

DCF-based intrinsic value with your own discount rate. See implied upside or downside against the live price. Own your thesis, don't rent someone else's target price.

๐Ÿงฎ

Backtest Assumptions

Enter your required return and stress-test your thesis against 5+ years of actual EDGAR filings. See how your valuation model would have held up historically. Build conviction from evidence, not narrative.

๐Ÿ“…

Commitments

Forward obligations, lease schedules, and contingent liabilities pulled from the notes to financial statements. See what management committed to that doesn't appear on the balance sheet face.

๐Ÿ“‹

Filings

Direct links to 10-K and 10-Q filings on SEC EDGAR, with segment breakdowns and MD&A extracts. Primary source, always. No summaries, no spin. The document institutions read before writing their notes.

๐Ÿ›๏ธ

Insider Activity

Director and officer transactions from SEC Form 4, parsed and presented alongside the financials. When insiders buy or sell at scale, the filing tells you first. No delay, no vendor interpretation.

๐Ÿ”

OBS Signals

Off-balance-sheet obligations, undiscounted operating leases, and contingent guarantees. The liabilities that don't appear in headline numbers but define solvency in a stress scenario. What sophisticated credit analysts always check.

๐Ÿšฆ

Risk

Quantified risk signals drawn from disclosures, financial ratios, and multi-period trends. Red-amber-green scoring so you know where to dig deeper, without reading every filing yourself. From early warning to conviction.

๐Ÿ”ฌ

Audit

Auditor opinion, going-concern flags, restatement history, and SOX 404 internal control findings. The institutional due diligence checklist: run before you invest, not after.

๐Ÿงช

Litmus

A composite financial health score built on 15+ primary-data inputs. One signal that summarises solvency, profitability, efficiency, and momentum. The first filter. The last line of defence.

๐Ÿ•ต๏ธ

Forensic Lens

Four specialist forensic models cross-examine the financials to surface distress risk before it reaches the headlines: Beneish M-Score (earnings manipulation), Piotroski F-Score (fundamental quality), and the Altman Z-Score and Ohlson O-Score (bankruptcy probability). The accountant's lie-detector, applied to every filing.

๐Ÿ’ฃ

Bond Market Stress

Stress-test the debt stack against rate shocks and spread widening. See how coupons, maturity walls, and refinancing needs hold up under adverse credit conditions. This is the scenario analysis fixed-income desks run before they price the risk into the equity.

๐Ÿฆ

Credit Analyst View

A lender's-eye read of the balance sheet: the Commitment Credibility Index (CCI), refinancing risk, and coverage ratios that reveal whether obligations can actually be serviced. See the company the way the people who lend it money do.

๐ŸŽจ

Custom Plot

Pick up to six figures from one company, such as revenue, cash flow, earnings per share or debt, and chart them together on the company's own financial year. Every point is marked filed, taken straight from the company's report, or derived, worked out by us from filed figures; anything the company never reported is left as a gap, never a zero. Sign in to use it; share price needs your own brokerage account connected.

๐Ÿ”€

Compare

Put up to three companies side by side on one calendar, so a company whose year ends in September lines up quarter for quarter with one whose year ends in December. Hover any point and it names which of that company's own quarters you are looking at, so the alignment hides nothing. Sign in to use it; share price needs your own brokerage account connected.

๐Ÿค–

AI InsightsComing soon

AI-generated narrative analysis that synthesises every metric, filing, and signal into a plain-English verdict. The analyst's memo, written in seconds. Coming soon.

Our sources

Primary sources, as published. No vendor adjustments, no estimates.

Company figures

SEC EDGAR

Every fundamental figure comes from the 10-K, 10-Q and 20-F filings companies submit to the U.S. Securities and Exchange Commission (sec.gov/edgar), as reported. How we use filings

Interest rates

The Federal Reserve (FRED)

The 10-year Treasury yield, the risk-free rate behind every valuation, from FRED at the Federal Reserve Bank of St. Louis: now 5.17%, the October 2026 average so far. Why this rate matters

Source: FRED, Federal Reserve Bank of St. Louis. This product uses the FREDยฎ API but is not endorsed or certified by the Federal Reserve Bank of St. Louis.

Beat Index Research Desk

Deep dives into SEC filings, one company at a time. Search by ticker to find analysis on any stock in our coverage.

MUAMD

Micron vs AMD: Which Is the Better Buy? Seven Times the Cash Flow, a Twelfth of the P/E

Micron now generates about seven times AMD's free cash flow and trades on a P/E of 12 against AMD's 147. On the numbers Micron looks far cheaper. But Micron's numbers are the best year a memory maker has ever had, and memory is the most cyclical business in semiconductors. Here is what the filings show, what each price needs to be right, the risks, and where we lean.

NFLX

Is Netflix (NFLX) Undervalued? Back at Its 2021 Price, With 2.4 Times the Earnings

Is Netflix undervalued? The shares are back where they were in October 2021. Since mid-2022, revenue is up 56%, underlying earnings per share are up 2.4 times, and buybacks now exceed underlying free cash flow. Here is what the filings show, what the market may be worried about, why we think the shares are undervalued, and what could prove us wrong.